BAs and Visualizing Information

This post originally appeared December 10, 2010 on BetterProjects.net.
One of my favorite websites is InformationIsBeautiful.net. If I had any visual artistic skill (my sketches make stick figures look ashamed), this would be what I was doing instead of blogging. One of the latest items from the site really struck a nerve with me. Take a look at it:
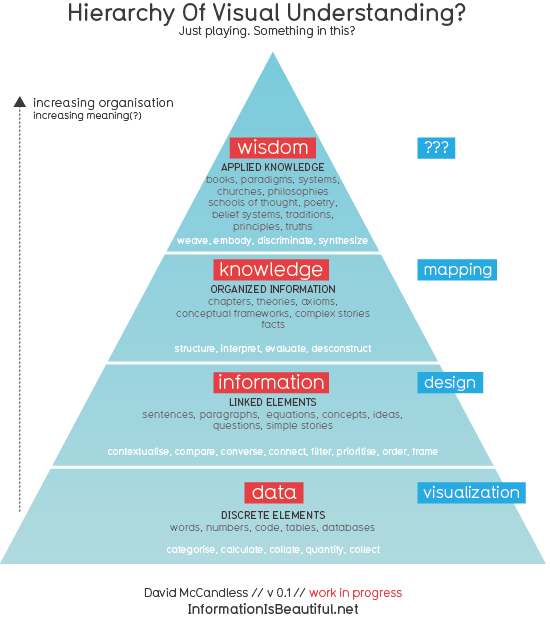 |
I’ve had a similar idea in my head for a long time and David McCandless came closer to putting it down on paper than anyone I’ve ever seen. To me, this is the core of what a Business Analyst does… you take lots of discrete data elements, apply organization to them to create information. You then take information and provide it to your stakeholders in a format they can understand; what I’ll call knowledge packets. It is then the job of our stakeholders to take that knowledge and to make wise decisions from it.
What do you think? Does the chart make sense? Are there any ways in which you would change it?